Window Leveling Panel
The Window Leveling panel, shown below, offers precise controls for selecting threshold values and window position, choosing color mapping and opacity mapping modes, adjusting gamma, as well as for editing and creating Lookup tables (LUTs).
Window Leveling panel

|
|
Icon |
Description |
|---|---|---|
| Pin | In cases in which you are working with multiple datasets, you can ‘pin’ the Window Leveling panel controls for LUT editing, color mapping, and opacity mapping to a selected dataset. | |
| Open | Creates an additional instance of the Window Leveling panel, which can be ‘pinned’ to another dataset. | |
|
LUT Editor |
- - |
The integrated LUT Editor, shown below, displays a plot of the current image’s look-up table (LUT) that describes the shade or color that is displayed for each of the possible pixel values, as well as its opacity. When set to “Piecewise”, control points are inserted into the histogram that highlight regions within specific arrays of intensity. By manipulating the color and alpha control points, the best overall contrast between various features can be achieved. You can edit any of the available LUTs, as well as create your own (see Using the LUT Editor).
The histogram at the top of the panel shows how values are distributed within a dataset. The darkest parts of the image will appear on the left side of the graph, the mid-tones will appear in the middle, and the brightest parts (highlights) on the right side. If required, you can select the Log Y option to plot the Y-axis in log scale. |
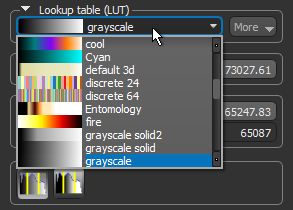
| Lookup table (LUT) |
Lets you choose a lookup table (LUT). The available LUTs are selectable in the drop-down menu, as shown below.
|
|
| Selected range |
The minimum and maximum values in the Selected range box define the window width.
|
|
|
Plotted range/Data range |
- - |
The first set of values in Plotted range/Data range box define the range plotted on the histogram, while the second set displays the range of the selected dataset.
|
| Color mapping |
You can choose two options for mapping shades and colors to intensity values — Map to full data range or Map to selected window.
Map to full data range… If selected, color mapping will be applied independently of window leveling. This means that shades and colors mapped to specific values will be retained whenever leveling values are changed. Map to selected window… If selected, shades and colors will be mapped to the range of values defined by the window width. |
|
| Opacity mapping |
Options in the Opacity mapping box let you adjust global opacity, choose an opacity mapping mode, and adjust gamma. 
Opacity slider… Lets you adjust the global opacity of the selected dataset. Opacity mapping modes… Lets you choose a mapping mode (see Opacity Mapping Modes). Gamma… Gamma can be adjusted for each view in a scene with the slider or by changing the current value. The gamma curve, which is shown on the Window Leveling histogram, determines how tones are displayed in a view by defining the relationship between input values and the resulting image luminance. As shown in the following illustration, adjusting gamma will affect the perceived brightness of an image by making dark regions lighter. You should note that the local gamma typically rises from 1.0 to about 2.0.
You should also note that while gamma affects the brightness of a display, it is not identical to brightness. This is because gamma adjustments are not linear, like brightness levels are. Instead, the gamma setting applies a function to the input levels to produce the final output level. This means that the extreme dark and light points are not as affected as the mid-tones, which are enhanced more because of the non-linear function. |
|
| Window Level |
|
Lets you adjust window leveling of the selected dataset (see Adjusting Window Leveling with the Window Level Tool). |
| Area |
|
Allows you to apply leveling computed within a selected area on a 2D image to the whole image in the 2D views of the selected scene (see Automatically Adjusting Window Leveling with the Area Tool). |
| Reset |
|
Resets the original window leveling values. |


You can choose a mapping mode for 2D and 3D views in the Opacity mapping box as described in the following tables.
The following Opacity mapping modes are available for 2D views.
|
|
Icon |
Description |
|---|---|---|
| Allpass constant |

|
In this mode, the opacity of the values within the window will set to a constant 50%. Note Gamma cannot be adjusted in this mode. |
|
Bi-gated ramp |
|
In this mode, the opacity of the values to the left of the lower threshold will be set to 0, while the opacity of the values to the right of the upper threshold will be set as per the highest value within the window. The opacity of the values within the window will be set within a linear ramp, which can be modified by adjusting the gamma. |
|
Piecewise |

|
In this mode, the opacity of the values within the window will be set to the value of the alpha control points, while the opacity of the values to the left of the lower threshold will be set as per the leftmost control point and the opacity of the values to the right of the upper threshold will be set as per the rightmost control point. Note You can convert other modes, such as Bi-gated ramp or Bandpass Gaussian to ‘Piecewise’ by choosing More > Sample Alpha as Piecewise. Note Gamma cannot be adjusted in this mode. |

The following Opacity mapping modes are available for 3D views.
|
|
Icon |
Description |
|---|---|---|
|
Left-gated ramp |
|
In this mode, the opacity of the values to the left of the lower threshold will be set to 0, while the upper threshold is disabled. The opacity of the values within the window will be set within a linear ramp, which can be modified by adjusting the gamma. |
|
Bi-gated ramp |
|
In this mode, the opacity of the values to the left of the lower threshold will be set to 0, while the opacity of the values to the right of the upper threshold will be set as per the highest value within the window. The opacity of the values within the window will be set within a linear ramp, which can be modified by adjusting the gamma. |
|
Bandpass ramp |
|
In this mode, the opacity of the values to the left of the lower threshold and to the right of the upper threshold will be set to 0. The opacity of the values within the window will be set within a linear ramp, which can be modified by adjusting the gamma. |
|
Bandpass Gaussian |
|
In this mode, the opacity of the values to the left of the lower threshold and to the right of the upper threshold will be set to 0. The opacity of the values within the window will be set within a Gaussian window. Note Gamma cannot be adjusted in this mode. |
|
Bandpass constant |
|
In this mode, the opacity of the values to the left of the lower threshold and to the right of the upper threshold will be set to 0. The opacity of the values within the window will set to a constant 50%. Note Gamma cannot be adjusted in this mode. |
|
Piecewise |
|
In this mode, the opacity of the values within the window will be set to the value of the alpha control points, while the opacity of the values to the left of the lower threshold will be set as per the leftmost control point and the opacity of the values to the right of the upper threshold will be set as per the rightmost control point. Note You can convert other modes, such as Bi-gated ramp or Bandpass Gaussian to ‘Piecewise’ by choosing More > Sample Alpha as Piecewise. Note Gamma cannot be adjusted in this mode. |